 Odds
Odds
- are just another way to speaking of probabilities
- The odds of Bayern Munich winning are 2 to 1
- It's twice as likely that they win, than tie or loosing
- The left-hand side is called the log-odds or logit. We see that the logistic regression model has a logit that is linear in .
- the logarithm of the odds is a linear function that can be solved with
- least squares approach
- maximum likelihood method
- gradient descent
Interpretation of the Regression Table
- the logarithm of the odds of having a default ()
is explained with a linear model

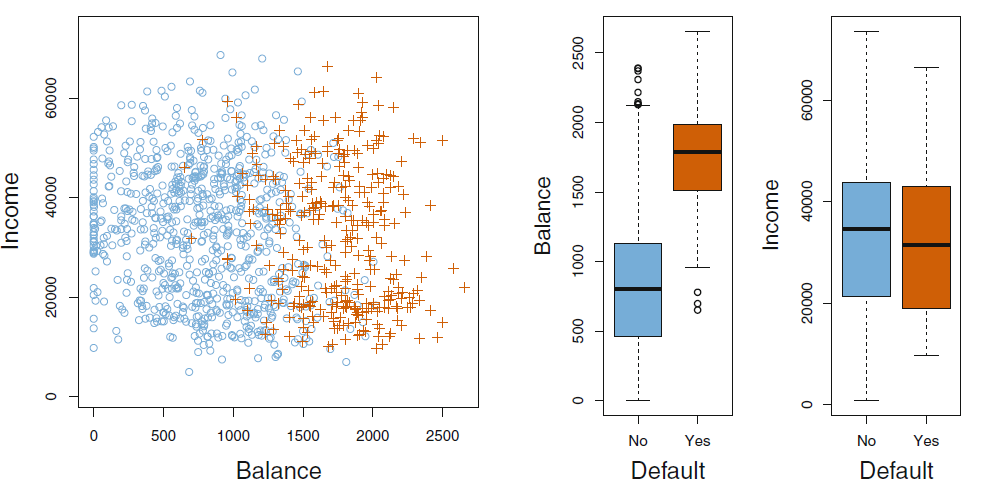
- balance () has a positive effect in the probability to default
- this effect is significant
- the intercept is harder to interpret
 Making a Prediction
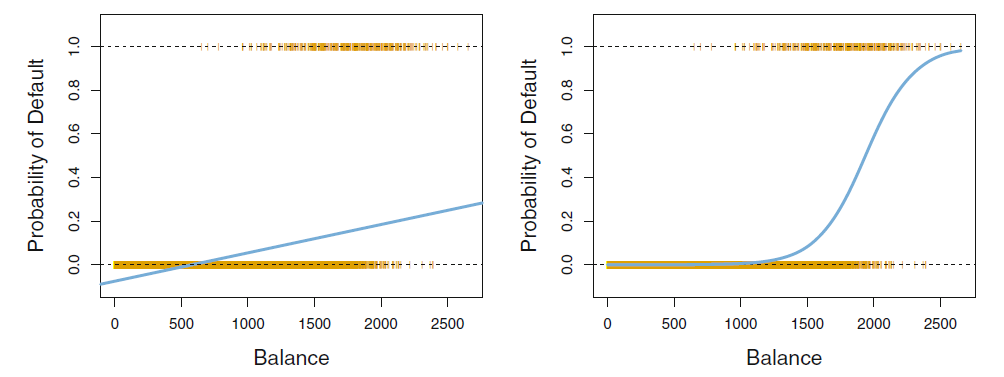
- We can just plug in the values of predictors
and get a probability value (between and as a prediction) - Probability of a default with
- a balance of
- a balance of
 Task
Task
Given the following Regression Model of the odds of having high blood pressure from Lavie et al. (BMJ, 2000) surveyed adults referred to a sleep clinic
| Risk factor | Coefficient | p-value |
|---|---|---|
| Age ( years) | 0.805 | 0.04 |
| Sex (male) | 0.161 | 0.03 |
| BMI () | 0.332 | 0.04 |
| Apnoe Index ( units) | 0.116 | 0.23 |
- Does the model have an intercept?
- Is the apnoea index significantly predictive of high blood pressure?
- Is sex a predictor of high blood pressure?
data is changed from the original paper, https://www.healthknowledge.org.uk/public-health-textbook/research-methods/1b-statistical-methods/multiple-logistic-regression
- Does the model have an intercept?
- no
- Is the apnoea index predictive of high blood pressure?
- no significance as
- Is sex a predictor of high blood pressure?
- males have significantly higher odds of having high blood pressure?
 Case Study
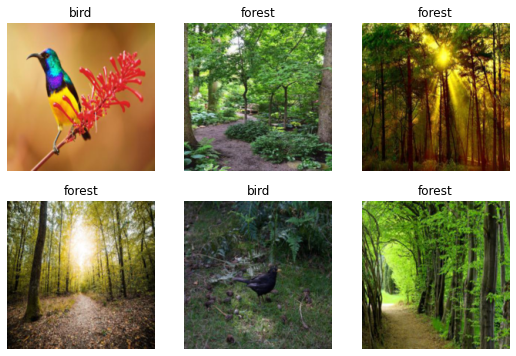
- We will use deep neural networks to classify images of birds and trees

2.7.2 Classification - Evaluating Classification Results
 Learning objectives
You will be able to
- read a confusion matrix and calculate classification errors based on its results
- set classification thresholds to generate a ROC-curve of a classifier
- compare models using ROC and AUC
No prediction is perfect

- Predicted variable : Will the debitor default
- Predictors:
- : What is their current account balance
(default ==True) |
balance |
|
|---|---|---|
| 1 | 4000 | 0.667 |
| 0 | 2000 | 0.587 |
| ... | ... |

- Probability of a default for the second person with
- a balance of
- We can decide to predict default based on the threshold probability of
- Still the second person did not default
- a balance of
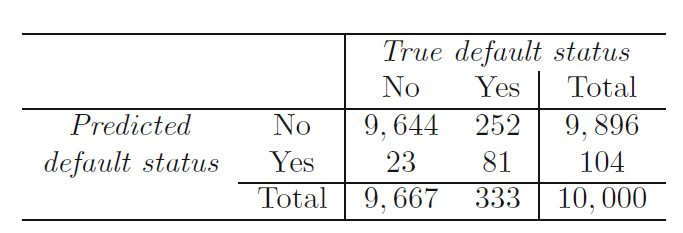
Confusion Matrix
- making a prediction, we will make errors
- with categorical data we cannot use the accuracy measures from regression
https://towardsdatascience.com/understanding-confusion-matrix-a9ad42dcfd62
| Predicted | Values | Total | ||
|---|---|---|---|---|
| Negative (0) | Positive (1) | |||
| Actual | Negative (0) | True Negative () | False Positive () | |
| Values | Positive (1) | False Negative () | True Positive () | |
| Total |
| Predicted | Values | Total | ||
|---|---|---|---|---|
| Negative (0) | Positive (1) | |||
| Actual | Negative (0) | True Negative () | False Positive () | |
| Values | Positive (1) | False Negative () | True Positive () | |
| Total |
- True Positive ():
- You predicted positive and it’s true.
| Predicted | Values | Total | ||
|---|---|---|---|---|
| Negative (0) | Positive (1) | |||
| Actual | Negative (0) | True Negative () | False Positive () | |
| Values | Positive (1) | False Negative () | True Positive () | |
| Total |
- True Negative ():
- You predicted negative and it’s true.
| Predicted | Values | Total | ||
|---|---|---|---|---|
| Negative (0) | Positive (1) | |||
| Actual | Negative (0) | True Negative () | False Positive () | |
| Values | Positive (1) | False Negative () | True Positive () | |
| Total |
- False Positive (): (Type 1 Error):
- You predicted positive and it’s false.
| Predicted | Values | Total | ||
|---|---|---|---|---|
| Negative (0) | Positive (1) | |||
| Actual | Negative (0) | True Negative () | False Positive () | |
| Values | Positive (1) | False Negative () | True Positive () | |
| Total |
- False Negative (): (Type 2 Error):
- You predicted negative and it’s false.
Example: Corona-Test
- What error do we want to minimize, when everyone who is sick should stay at home?
- We want to to find all positives ()
- False negatives () are dangerous
| has Corona | test result | Classification for threshold 0.5 | Error-Type |
|---|---|---|---|
| 0 | 0.4 | 0 | |
| 1 | 0.9 | 1 | |
| 0 | 0.7 | 1 | |
| 1 | 0.7 | 1 | |
| 0 | 0.3 | 0 | |
| 1 | 0.4 | 0 |
- A threshold is a probability value we set to decide on the predicted classification based on the predicted probability
| Predicted | Values | Total | ||
|---|---|---|---|---|
| Negative (0) | Positive (1) | |||
| Actual | Negative (0) | |||
| Values | Positive (1) | |||
| Total |
- There is one false negative that is not detected to have corona with this threshold
Task
- Select a threshold, so that no false negative remains
- Fill the confusion matrix
15 minutes
| has Corona | test result | Classification for threshold ... | Error-Type |
|---|---|---|---|
| 0 | 0.4 | ||
| 1 | 0.9 | ||
| 0 | 0.7 | ||
| 1 | 0.7 | ||
| 0 | 0.3 | ||
| 1 | 0.4 |
| has Corona | test result | Classification for threshold 0.4 | Error-Type |
|---|---|---|---|
| 0 | 0.4 | 1 | |
| 1 | 0.9 | 1 | |
| 0 | 0.7 | 1 | |
| 1 | 0.7 | 1 | |
| 0 | 0.3 | 0 | |
| 1 | 0.4 | 1 |
| Predicted | Values | Total | ||
|---|---|---|---|---|
| Negative (0) | Positive (1) | |||
| Actual | Negative (0) | |||
| Values | Positive (1) | |||
| Total |
| Predicted | Values | Total | ||
|---|---|---|---|---|
| Negative (0) | Positive (1) | |||
| Actual | Negative (0) | |||
| Values | Positive (1) | |||
| Total |
- No, we find all positives
- However, we send one more person home as a false positive
 Thresholds
- In most classification problem, we have to balance (at least) to different errors
- False Positive (): (Type 1 Error
)
- False Negative (): (Type 2 Error
)
- False Positive (): (Type 1 Error
- By moving the thresholds, we can calibrate a classifier (that predict a class probability) so that is suits the use case
- To compare classifiers, we can use a receiver operating characteristic
 Receiver operating characteristic
- to create a line, we use the same model but change the threshold
- how much more do we get, if we increase the rate by changing the threshold?
- Sensitivity / Recall:
- the perfect classifier would achieve all without any
Good Classifier
- red: distribution of the predictions for negatives
- green: distribution of the predictions for positives
- only few of the guesses land on the wrong side of the threshold
https://towardsdatascience.com/demystifying-roc-curves-df809474529a
Random Classifier
- the classifier has to power to differentiate between the classes
- no matter where we place the threshold, we will get the same number of and
https://towardsdatascience.com/demystifying-roc-curves-df809474529a
 AUC (Area Under the ROC Curve)
- We can measure the area under the ROC-curve to evaluate the skill of a model
- A perfect classifier has a AUC of
- a random classifier has a AUC of
https://towardsdatascience.com/understanding-the-roc-curve-and-auc-dd4f9a192ecb
Other Accuracy Measures for Classifiers
- for a model and a given threshold, we have the the confusion matrix to get a first impression of it's performance
- it is helpful to have a single metric to describe a models accuracy
https://en.wikipedia.org/wiki/Precision_and_recall#/media/File:Precisionrecall.svg
Accuracy
What proportion identifications were correct?
How often do we hit the target?
You don't have to learn the formulas, but should be able to calculate the values if formulas and data are given
Precision
What proportion of positive identifications was actually correct?
Of everything we predict to be positive, how many are really positive?
Sensitivity / Recall
What proportion of actual positives was identified correctly?
How many of the positives do we find?
F1-Score
- The F1 score is the harmonic mean of the precision and recall.
 Task
Task
- Calculate accuracy, precision, recall and F1-Score for the following examples
10 minutes
Corona Test I
| Predicted | Values | Total | ||
|---|---|---|---|---|
| Negative (0) | Positive (1) | |||
| Actual | Negative (0) | |||
| Values | Positive (1) | |||
| Total |
Corona Test II
| Predicted | Values | Total | ||
|---|---|---|---|---|
| Negative (0) | Positive (1) | |||
| Actual | Negative (0) | |||
| Values | Positive (1) | |||
| Total |
 Unbalanced Data Sets
| Predicted | Values | Total | ||
|---|---|---|---|---|
| Negative (0) | Positive (1) | |||
| Actual | Negative (0) | |||
| Values | Positive (1) | |||
| Total |
Given this data. Is it hard to train an model with high accuracy (high share of correct predictions)?
- The simple model
- always predicts negative
| Predicted | Values | Total | ||
|---|---|---|---|---|
| Negative (0) | Positive (1) | |||
| Actual | Negative (0) | |||
| Values | Positive (1) | |||
| Total |
- Datasets, where one group is much more common that the other are called unbalanced
- This can lead to a special case of over-fitting (as in this example)
 Training on Unbalanced Data Sets
- a common way to solve this problem is to create a balanced training data set
- depending on the amount of data available
- under-sampling: omit some instances of the majority class in the training
- over-sampling: multiply some instances of the minority class in the training

